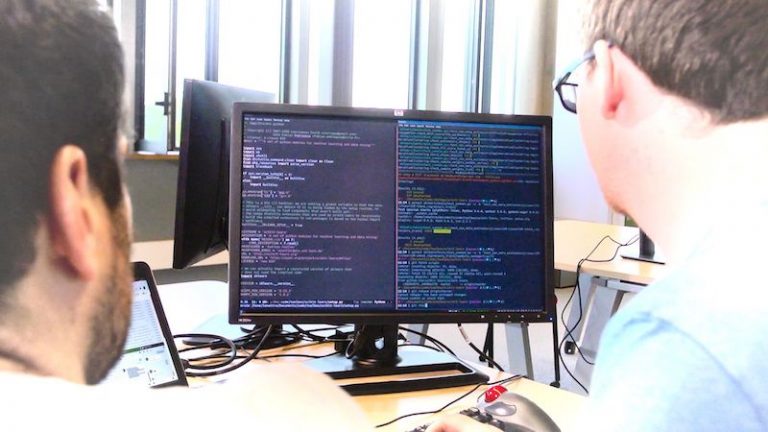
Focus on ScikitEDS, a project of the Covid Mission of Inria led by Alexandre Gramfort (EPC Parietal). Following the call for good will launched by AP-HP last March, a team of 9 data science experts was mobilized to help analyze, quantify, predict and visualize daily clinical data related to Covid-19 and uploaded from the 39 AP-HP hospitals to provide automatic reports on the flow of sick patients (return home, recovery, hospitalization, resuscitation) on a daily basis.
As indicated by Inria, this EDS-COVID database contains pseudonymized data from more than 100,000 patients who have had a PCR test in PA-HP. Alexandre Gramfort, accompanied by Olivier Grisel and Guillaume Lemaitre (Scikit-Learn consortium), Gael Varoquaux, Thomas Moreau, Demian Wassermann (Parietal Inria Saclay team), Jill-Jênn Vie (SequeL Inria Lille team), Julien Champ (Zenith team, Montpellier), and Loic Estève (Experimentation and Development Department of the Inria centre in Paris) have decided to support AP-HP on the data processing aspect of the crisis.
These 9 Inria scientists worked on an operational crisis management software for the AP-HP healthcare staff, mainly in Python. But as they say, the team has also used a lot of free software including Jupyter, PostgreSQL, the PyData ecosystem with Pandas, Matplotlib, scikit-learn and Plotly. Project management is done via GitLab as well as the integration and continuous deployment of results via GitLab CI/CD and GitLab Pages.
“The AP-HP gives us access to all the data in the EDS-COVID database via its Jupyter portal which makes remote and secure access possible. We provide the EDS with software building blocks: a Python library that facilitates work on SQL databases and a data quality monitoring tool that simplifies the identification of quality problems (data entry or cross-referencing problems, for example). One of the biggest difficulties of this project lies in managing the heterogeneity of data sources (variability of software tools, different data formats, missing data)”.
The ScikitEDS project has enabled the development of a “software stack for the deployment of a web dashboard, a dashboard allowing the visualization of EDS-COVID data: demographics, hospitalization statistics including length of stay, risk factors and co-morbidities, impact of drug prescriptions”. This software provides the AP-HP with a synthetic table containing more than 200 descriptive variables for each patient.
“The big challenge of this project was to succeed in working in the emergency room in a collective way, with many actors each with different work habits and using a different programming language. This is why, during the development phase of the EDS-COVID task force, we had twice-daily, then daily, exchanges with the doctors: we could thus check the quality of the visualisations and data almost in real time.
Subsequently, we continued the discussion in the form of more specific working groups (survival models to estimate the median length of stay in resuscitation, geographical origin of patients, impact of co-morbidities such as obesity on disease progression), with constant dialogue between Inria physicians and scientists.
ScikitEDS, the result of that work over several weeks, is now used in dozens of research projects within the PA-HP.”
Translated from Focus sur ScikitEDS : un outil de visualisation de suivi des flux de patients malades


